Small Simplicity

Understanding Intelligence from Computational Perspective

Feb 17, 2020

[Paper] Data Analysis with Latent Variable Models

Data Analysis with Latent Variable Models - Blei, 2014

Reading Purpose

Q: Why am I reading this?
A: To understnad the motivation behind latent variable models In particular, I want to be clear about the relations among: Probablistic Graphical Model vs. Latent Variable Model vs. Bayesian Inference. They all come up in a very similar setting, but what exactly are they?

Reading Goal

Q: What is the product/outcome of this reading?

  1. Be able to articulate the definition of Latent Variable Model

    A latent variable model is a probabilistic model that encodes hidden patterns in the data (p.203)

  2. Give an example in Text domain and Image domain where the model is used

  3. Describe the general workflow using the model with Bayesian inference

(1) Build a model
Encode our assumptions about our data and hidden quantities that would have? could have? generated the observations as a joint distribution of hidden random variables and observation(aka. data) random variables.

  • Output of this "build" step:
    • definition of H (hidden random vars), V (observation random var)
    • Description of the model in one of the specification
      • Describe the model with its generative process, or
      • Descrive the model with its the joint distribution ,P(H,V), or
      • Describe the model with its graphical model representation

(2) Compute
Given observation data D, compute the conditional distribution of hidden variables given D (ie. the random variable here can be written as "h|x=D".

  • NB: this is not the same random variable as "h".
  • This computing process is often referred to as "inference" (I think?), as in "Bayesian inferece". However, this is different from the "inference" used to describe the processing of using a trained model as the test time to "infer", for example, the class of a new test image. Here, we are "inferring" the conditional random varialble h|x=Data, which is equivalent to say "compute the conditional distribution of the random variable, h|x=D.
  • NB: This conditional distribution is often referred to as posterior. The reason it makes sense to call it so is because we are looking at the hidden quantities "posterior" to the data observation process. This is the term from the Bayseian community. But since our model is neither about being bayesian or not (see Dustin's post: "model is just a joint distribution of hidden and observation random variable. To compute the conditional distribution of hidden|observed data, or the predictive distribution P(Xnew|X=data), we can use either frequentist's tools (Eg. EM) or bayesian's tool(eg. hierachical something <- I don't know what this it), I will stick to calling this probability distribution as the "conditional" (as opposed to "posterior") distribution.
  • so, the outputs of the "compute" step are:
    • the conditional distribution, P(H|X=D)
    • the predictive distribution, which can be computed from the conditional distribution above

(3) Critique [todo]


Prelim

Q1: What is a probabilisitc graphical model?

Stanford's CS228:

"Probabilistic graphical models are a powerful framework for representing complex domains usinb probability distributions, with numerous applications in achine learning, computer vision, natural language processing and computational biology. Graphical models bring together graphy theory and probability theory, and provide a flexible framework for modeling large collections of random variables with complex interactions"

Q2: What is a Latent Variable Model?

Cross Validated:

"...latent variable models are graphical models where some variables are not seen, but are the causes to the observations. Some of the earliest models were factor analysis. Here the idea is to find a representation of data which reveals some inherent structure of the data..." - link

Q3: What do you mean when you use "bayesisan" to describe a model or an inference method?

Dustin Tran's comment on calling a model "bayesian model" (See Bullet 1)

I strongely believe models should simply be gramed as a joint distribution p(x, z) for observation/data variable x and latent variables z

NB: this is in line with Blei's definition on a model, provided in this article (pg. 207)

A model is a joint distribution of x and h, p(h,x | hyperparam) = p(h|hyperparam) * p(x|h), which formally describes how the hidden variables and observations interact in a probability distribution

Dustin continues his comment on calling a model either "bayesian" or "frequentist". He argues this is not the right way to communicate because "there is no difference!"

... They are all just "probabilistic models". The statistical methodology -- whether it be Bayesian, frequentist, fiducial, whatever -- is about how to reason with the model given data. That is, they are about "inference" and not the "model" (Bullet 2)

This comment really clarifies my confusion on when to use the adjective "Bayesian" (ie. to describe a model? or a method of inference?):

  • "Bayesian" approach is one way to do your inference (eg. compute the conditional distribution of P(hidden vars | x = observed_data).
  • NB: I'm intentionally using the term conditional distribution (rather than posterior distribution of hidden variables because "posterior" is the term most often assosiated with the Bayesian inference. But, as Dustin says, we can do inference (ie. compute -- exactly or approximately -- the conditional distribution of the random variable, (z|x=Data) using either of what we ascribe as a Bayesian tool (eg. hierachical models <-- I don't know what this is) or a frequential tool (eg. EM) .
  • NB2: in Bayesian framework, "posterior" means "after observations are gathered and incorporated into our reasoning about the hidden variables, ie. those that remain unobservable"

Sec2: Model

The descritpion of specifying how the observations arise from the hidden quantities (aka. the generative process of the data) is where everything starts. The story you are constructing/assuming about this generative process can be expressed in 1) plain english, 2) the joint distribution between the hidden variable and observation variables, and how the joint distribution can be factored, and 3) the probabilistic graphical model. So the first thing is to write this generative process (btw this is "your" choice, "your" story, ie, the assumptions you choose/hypothesize).

  • Step 1: Write in plain english what your hidden quantities that are assumed to have given rise to the observations
  • Step 2: Write in plain english how they give rise to the observations. That is, what is the dependency like between the hidden quantities and the observations?
  • Step 3: Now, translate the english description (that is, the definition of your model and the dependency relations) to mathematical expression using the joint distribution (<- encodes your assumptions about the data generative process) and its facotirazation (<- encodes depedency relations)
  • Step 4: Represent the joint distribution (or the generative process) as a graphical model

  • Generative process

  • indicates a pattern of dependence among the random variable
  1. Joint distribution
  2. The traditional way of representing a model is with the factored joint distribution of its hidden and observed variables
  3. This factorization comes directly from the generative process
  4. Graphical model

Aside: Why a joint distribution?

Q: What can we do with a joint distribution of the hidden and observable variables? A: Joint distribution is like the root of all other distributions. For example, we can derive conditional distribution of hidden variables given observable variables taking specific values (ie. the observations in our data): P(H|X=Data).

NB2: Why the conditional distribution of H|X=Data?

NB: aka. the posterior distribution of the hidden variables given observations

We use the posterior to examine the particular hidden structure that is manifest in the observed data. We also use the posterior (over the global variables) to form the posterior predictive distribution of the future data. ... In section 5, we discuss how the predictive distribution is important for checking and criticizing latent variable models
[Blei 2014, pg. 209]

Story so far,

  • model = joint distribution of hidden and observable variables
  • Once we have a defined model, and observations (D) , then we can compute the conditional distribution of H|X=D

    • what does this posterior distribution tell us?: it helps examine the partidular hidden structure that is manifest in the observed data

    • From the conditional distribution, we can compute the predictive distribution of the future data (given the model and data D). This predictive distribution is important for checking and criticizing latent variable models


Sec3: Example models

Q: Why am I reading this? A: What are the outcome/product of reading this section?

  • Articulate the 5 example models in three ways of specficying a model. See Sec.2.1, 2.2, 2.3 for each of the three ways.
    • Describe each model by its generative process (sec 2.1)
    • Describe each model by its joint distribution (sec 2.2)
    • Describe each model by its graphical model (sec 2.3)

Most important figure blei2014

[todo]

Gaussian Mixture model

Linear Factor model

  • More general category is called "Factor models"
  • Factor models are important as they are components in more complicated models (eg. the Kalman filter)
  • Examples of statistical models that fall into this category: principal component analysis, factor analysis, canonical correlation anlysis
  • Relation to Gaussian Mixture model: in Gussian mixture model, our z_n's are discrete random vars. Factor model's use 'continuous` hidden variable z.

  • Generative process

  • Joint Distribution
  • Represent the model as a graphical model

Mixed-Membership model

Matrix factorization model

Hidden Markov model

Kalman filter model


Running list of definitions Running list of terms I can't give a definition or construct an example/story out of it yet 1. A numbered 2. list * With some * Sub bullets

Feb 01, 2020

Bayesian Data Analysis for dummies like me

Explaining physical phenomenon consistent with observations

Bayesian data analysis is a way to iteratively building a mathemtical description of a physical phenomenon of interest using observed data.

Setup

Bayesian inference is a method of statistical inference in which Bayes' Theorem is used to update the probability for a hypothesis (\(\theta\)) as more evidence or information becomes available [wikipedia].

Therefore, it is used in the following scenario. I'll refer to the workflow as the workflow of "Bayesian data analysis" following Gelman.

  1. We have some physical phenomenon (aka. process) of interest that we want to describe with mathematical language. Why? because once we have the description (aka. mathematical model of the physical phenomenon), we can use it to explain how the phenomenon works as a function of its inner components, predict how it would behave as the inner components or its input variables take different values, (... any other usage of the mathematical model?)

  2. We decide how to describe the phenomenon using a mathematical language by specifying:

    • Variables
    • Relations This is the step of "choosing a model family (aka. a statistical model)"
  3. Now we have specified a family of probability models, each of which corresponds to a particular hypothesis/explanation of the physical process of interest. What we need to do is, to choose the "best" hypothesis from all of these possible hypotheses. To do so, we need to observe how the physical phenomenon manifests by collecting data of the outcomes of the phenomenon.

  4. Collect data of the outcomes of the phenomenon.

  5. "Learn"/"Fit" the model to the data. (aka, "estimate" the parameters (\(\theta\)) with the data). In English, this corresponds to "find a hypothesis of the phenomenon that matches the observed data "best"". To find such hypothesis \(\theta \in \Theta\), we need to define what is means to be the "best" hypothesis given the model (aka. Hypothesis space) and the observed data. We formulate this step as an optimization problem:

    • choose a loss function \(L(\theta \mid \text{model}, \bar{X})\)
    • Solve the optimization problem of finding argmin of the loss:
      $$ \theta^{*} = \arg min ~~ L(\theta \mid \text{model}, \bar{x})$$
    • Note: \(L(\theta \mid \text{model}, \bar{x}) \equiv L(\theta \mid \Theta, \bar{X})\). So we can rewrite the optimization objection as:
      $$ \theta^{*} = \arg min_{\theta \in \Theta} ~~ L(\theta \mid \bar{x})$$

More specific scenario: a phenomenon with unobservable variables

Most physical phenomenon involves variables that we can't directly observe. These are called "Latent variables", and a statiscal model with such unobservable variables (in addition to observed/data variables) are called "Latent Variable Model". When we are focusing on the latent variable model, we often use \(Z\) as the latent variables and \(X\) as the data sample variable. That is, if we have \(N\) observation, the sample variable will be a vector of \(N\) data variables: \(X = {X_1, X_2, \dots , X_N }\). The general setup of Bayesian data analysis workflow above (ie. choose a model \(\rightarrow\) collect data \(\rightarrow\) fit the model to the data \(\rightarrow\) criticize the model \(\rightarrow\) repeat). We can express the bayesian data analysis workflow using these notations as follows: (Note these notations are consistent with Blei MLSS2019.)

  • In English, describe what is the physical phenomenon of interest
  • Choose a statistical model by specifying

    • variables (nodes in the graph)
      • data variables (aka. observable variables): \(X\)
      • latent variables: \(Z\)
    • relations (edges in the graph)
      • as a (parametrized) function of its nodes
        Let's denote the set of all parameters in the model, \(\theta\). Our statistical model can be expressed as: \(P(Z,X; \theta)\).
  • Collect data: \(\bar{X}\)

  • Fit the model to the observed data
    • Choose a loss function (a function wrt parameters): \(L(\theta;\bar{X})\) for \(\theta \in \Theta\)

Inference

Generally speaking, inference (which stems from the Philosophy of Science)

Bayesian inference method

Bayesian inference is a method of statistical inference in which Bayes' Theorem is used to update the probability for a hypothesis(\(\theta\)) as more evidence or information becomes available wikipedia.

  • My sketch
    bayesian-inference

It is not a model, it is a general method(aka. technique, algorithm) that allows to infer unknowns probabilistically via computing, eg. marginal and conditional distributions of the model, the distribution over the parameters given observed data, the conditional distribution over the latent variables given the observed data.

Since it is a general technique (or an appoarch to doing inference) that is not tied to a specific model or a problem, we can use it whenever a suitable setup is presented. In the Bayesian Data analysis workflow, I see two places where we can use the Bayes theorem to infer some unknown quantities in the model (ie. use bayesian inference to compute unknowns given knowns).

  1. Use bayesian inference method to learn the model from the observed data. That is, what is the probability of the parameter of the model given observation?

    $$ P(\theta \mid \bar{X})$$

  2. Use bayes' theorem to compute the conditional distribution of latent variables given observed data and a fixed parameter (eg. the learned parameter from step 1)

    $$ P(Z \mid \bar{X}, \bar{\theta})$$

Note: I was living in the smog under the impression that "Bayesian inference" is tied to either 1 or 2. But now I understand "bayesian inference" just means computing probability distribution over the unknowns (either because they are unobservable (ie. conditional distribution of latent variables given observed data), or a subset of variables (ie. marginal distribution) that requires further computation on the joint distribution (aka. the probability model)). So, as Wikipedia's definition clarifies, anytime we have a quantity (with prior distribution) and make observations regarding a relevant process, we can update the prior distribution using the observed data via Bayes Theorem. That is all that is in the intimidating word "Bayesian inference". Gosh, can we please give another name to this way of doing computation with a probability model and data assumed to come from the probability model? "Inference" is such intimidating word. I feel like I need to do philosophy to use this word and everytime I hear this term, I feel like I never understand what the heck it is about because I don't understand what inference means in Philosophy. Yikes! :[

Approximate Inference

When we cannot compute the "flipped" probability ("flipped" using the Bayes Theorem) because it is, for example, too computationally expensive, we sometimes resort to an approximation of the true "flipped" probability.

Variational Approximate Inference

People call this "Variational Bayes", which I find it very loaded and unclear whether if the term refers to a method of inference or some model family because both "V" and "B" are captialized and it gives me an impressions that it's a name of some specific class of probability distributions. Yikes2! :[ Please give another name to it.

Variational Approximate Bayesian Inference is:

a method of finding a "good" approximate distribution to the "flipped" distribution of your probability model (ie. \(P\) with a fixed parameter \(\bar{\theta}\)) (ie2: "flipped" using Bayes theorem given your probability model) by formulating a proper optimization problem.

So far, we have discussed about "bayesian inference", and the need to sometimes be content with an "approximation" to the "flipped" distribution (given a fixed parameter and observed data). The last thing to understand is the "variational" part, which correpsonds to formulating the search for a "good" approximation distribution as an optimization problem. As usual for an optimization problem, we need to define "goodness", or in this case "loss"

  • Sketch for understanding the motivation for variational bayesian inference method (aka. Variational Bayes)

variational-bayes

To be continued...

Feb 01, 2020

Multimodal Distribution in Image or Text domain

Q: What does "multimodal distribution" mean in computer vision literature (eg. image-to-image translation)?

While reading papers on conditional image generation using generative modeling (eg. "Toward Multimodal Image-to-Image Translation" by Zhu et al (NIPS 2017)), I wasn't clear what was meant by "one-to-many mapping" between input image domain and output image domain, "multimodal distribution" in the output image domain, or "multi-modal outputs" (eg. Quora).

Definition

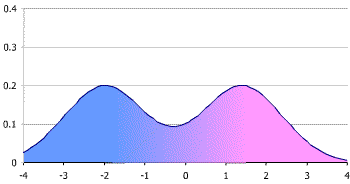
In statistics, a multimodal distribution is a continuous probability distribution with two or more modes (distinct peaks; local maxima) - wikipedia

(single-variable) bimodal distribution bivariate multimodal distribution
bimodal bivariate-multimodal

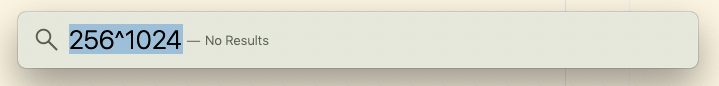
In high-dimensional space (such as an Image domain: \(P(X)\) where X lives in \(d\)-dim space where \(d\) is the number of pixels, eg. \(32x32=1024\). If each pixel \(X_i\) takes a binary value (0 or 1), the size of this image domain is \(2^{1024}\). If each pixel takes an integer value \(\in [0,255]\), then the size of this image domain is \(256^{1024}\). This, by the way, is too big to compute for Mac's spotlight:

too-big

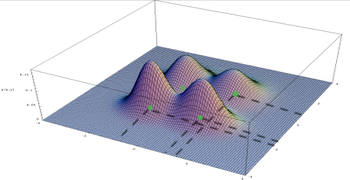
What it means by saying "the distribution of (output) image is multimodal" is to say, there are multiple images (ie. realization of the random variable (vector) X) with the (local) maxima value of the probability. In Figure below, the green dots represent the local maxima, ie. modes of the distribution. The configurations (ie. specific values/realizations) that achieves the (local) maximum probability density are the "probable/likely" images.

gan-multimodal-outputs multimodal-annot
The green dots representing modes of the distribution over the image domain (which is abstracted into a 2Dim space for visualization, in this case)

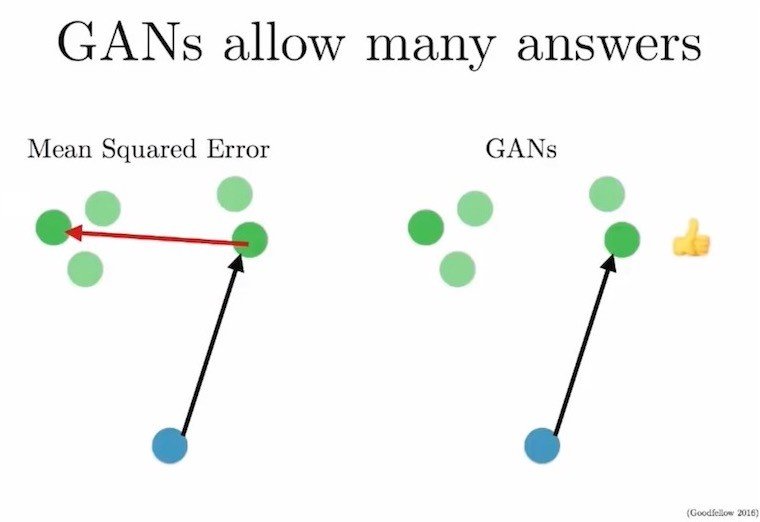
So, given one input image, if the distribution of the output image random variable is multi-modal, the standard problem of

Find \(x\) s.t. \(\underset{x \in \mathcal{X}}{\arg\max} P(X)\) (\(\mathcal{X}\) is the image space)
has multiple solutions. According to the paper (Toward Multimodal Image-to-Image Translation), many previous works have produced a "single" output image as "the" argmax of the output image distribution. But this is not accurate if the output image distribution is multi-modal. We would like to see/generate as many of those argmax configurations/output images. One way to do so, is by sampling from the output image distribution. This is the paper's approach.


Multimodal distribution as the distribution over the space of target domains [Domain adaption/transfer leraning]

So far, I viewed the multimodal distribution as a distribution over a specific domain (eg. Image domain), and the random variable corresponded to a realization, eg. an observed/sampled/output image instance. However,

Jan 20, 2020

Stochastic Thinking: Predictive non-determinism

MIT 6.0002 Lec4: Stochastic Thinking - YOUTUBE - predictive-nondeterminism

Often confusing categorization of a mathematical model: - SE - NB: in CS, people often use "deterministic" to mean non-randomized. This causes confusion: > "Determinism" means non-randomized. But, "Non-determinism" does not mean "randomized". - Determinism vs. Non-Determinism - ...? vs. stochastic/random - a stochastic (or random) process means,

&lt;p hidden&gt;![stochastic-process](images/stochastic-process.png)&lt;/p&gt;

I think better way to put this confusion into words is: "Nondeterinistc vs. Probabilistic models" - lavalle 2006

Jan 16, 2020

How to read a paper

Before you start

Q: "why are you reading this?"

  • Write it down where you can see it while reading the paper
    • Your purpose/goal of reading may change later. You will have a different experience then.
  • Is there a clear answer for this question? If not, you probably should not go on reading the paper

Warm-up (1 hr)

Think of it like going on a date with a new person. It's a new relationship, so don't try/expect to understand it in one go -- this is rude:)

  • Go to a quiet place for a few hours. Take your coffee with you

  • Start by reading the title and abstract

    • Goal: gain a high level overview of the paper
    • What are the main goals of the authors?
    • What are the high level results?
    • What is the problem the paper is solving?
  • Skim the paper (~15min)

    • Look at the figures
    • Jot down any keywords to look out for when reading
    • Goal: get a sense for the layout of the paper; get keywords to look out for
  • Go to introduction, especially if you feel unfamiliar with the field/paper. Okay to do it often.

    • Goal: get other references to fill in the gap in your understanding
  • Carefully step through each figure

    • why?: each figure contain key points of the paper. Authors spend a lot of time creating them and try to condense important information that supports their experiments/hypothesis. Pay particular attention to them.
    • Goal: Gain feel for what the authors think is most important; Write down what to look out for when reading the paper in detail (which will follow soon)
  • Take a break. Walk a bit.

First ~pass~ date (1.5hr)

Start taking high level notes. Expect new words, unfamiliar ideas. Mark those (you don't yet need to understand every single word), move on.

This is your first date with the paper. You are not going to learn all gory details about it, but you will ask good questions, understand what motivated the paper, and what it's going to be about.

  • Begin again with the abstract, skim through the introduction*

  • Diligent pass through the methods section

    • Goal: Draw down the overall setup
  • Read the results and discussion

    • Goal: write down the key findings and how they were determined
  • Take a break. Do jumping jacks. Sing a song.

Let's continue.

  • Revisit the figures: by now, you should be able to get into nitty gritties of the figures (having read the methods, results, and discussion section)
    • Goal: find more gems from the figures.
    • Spend about 30min ~ 1hr

Second full pass (1-2hrs)

Goal:

  • Focus on shoring up what you didn't understand previously,
  • Gain a command of the methods section
    • Test if you can write a pseudocode
  • Being a critical reader of the discussion section

Details:

  • Pay particular attention to the areas you marked as being difficult to understand. This is why you read a new paper. Don't play safe. Okay to feel uncomfortable. Okay to do it the following day (but don't push it back too much).

  • Leave no word undefined, unclear. Make sure you understand every sentence.

  • Skim through areas you feel confident in (eg. abstract, intro, results)

Guiding Questions

  • from Quora

  • What previous research and ideas were cited that this paper is building off of? (usually introduction)

  • Was there reasoning for performing this research, if so what was it? (introduction)
  • Clearly list out the objectives of the study
  • Did you write down 3 on your note?
  • Was any equipment/software used? (methods)
  • What variables were measured during experimentation? (methods)
  • Were any statistical tests used? What were their results? (methods/results)
  • What are the main findings? (results)
  • How do these results fit into the context of other research and their 'field'? (discussion)
  • Explain each figure and discuss their significance.
  • Did you write down 9 on your note?
  • Can the results be reproduced and is there any code available?
  • Name the authors, year, and title of the paper!
  • Are any of the authors familiar, do you know their previous work?
  • What key terms and concepts do I not know and need to look up in a dictionary, textbook, or ask someone?
  • What are your thoughts on the results? Do they seem valid?

Apply the technique

Most importantly, apply this guideline to your reading. Modify it to suit your personality.


Write a reading report

This is the end product of your reading. Without it, you didn't do your job.
^Really.

To check out ## check out: - Jason Eisner (JHU): [how to read a paper](https://www.cs.jhu.edu/~jason/advice/how-to-read-a-paper.html) - Prof.Murat at Buffalo: - [how to lead a reading group](https://tinyurl.com/rbree4d) - [how he reads a paper](http://muratbuffalo.blogspot.com/2013/07/how-i-read-research-paper.html) - how Prof. Nancy Lynch works: cool! - Cathy Wu, MIT: [how to lead a reading group](https://tinyurl.com/rbree4d)
← Previous Next → Page 2 of 5